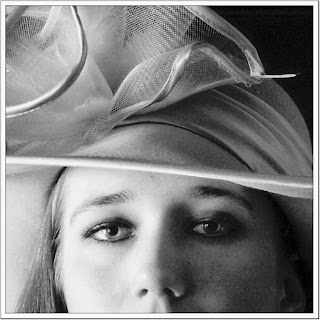
This opencv tutorial is about drawing histogram of a grayscale image.
What is a Image Histogram?
What is a Image Histogram?
Histogram
of an image represents the relative frequency of occurrence of various tonal
values of an image. In other words it is a graphical representation of the
intensity distribution of an image.
Simply
said, it plots the number of times (frequency) each intensity values(pixel
values) occurs in image.
E.g.:
Consider the following matrix of an image :-
1
|
4
|
7
|
6
|
2
|
5
|
5
|
7
|
3
|
5
|
3
|
3
|
7
|
5
|
6
|
3
|
4
|
7
|
1
|
5
|
4
|
2
|
2
|
3
|
Here the
depth of the image is 8.Since the highest value of pixel in this image is 7
Note:-Depth
of n represents that the range of pixel values is from 0 to n-1
Histogram
shows the pattern of distribution of pixel in an Image.
The above
image contains 2 pixels of intensity 1, 3 pixels of intensity 2, 5 pixels of
intensity 3 and so on.
This can be
tabulated as:
Pixel
Value
|
No.
of Pixels
|
0
|
0
|
1
|
2
|
2
|
3
|
3
|
5
|
4
|
3
|
5
|
5
|
6
|
2
|
7
|
4
|
The
following graph shows the histogram of the above image:-
What is
histogram equalization?
Histogram
equalization is defined as equalizing the intensity distribution of an image or
flattening the intensity distribution. It helps in enhancing the contrast of
the image.
The graph
of the equalized histogram looks like this:
Here is the opencv histogram equalization code :
#include "opencv2/highgui/highgui.hpp"
#include "opencv2/imgproc/imgproc.hpp"
#include <iostream>
#include <stdio.h>

using namespace cv;
using namespace std;

int mainundefined)
{
  //Declare the source and destination images as well as the windows names:
  Mat src, dst;
  char* source_window = "Source image";
  char* equalized_window = "Equalized Image";

  // Load image
  src = imreadundefined "C:\\Users\\arjun\\Desktop\\input.jpg", 1 );

  ifundefined !src.data )
    {
     cout<<"No image Found "<<endl;
     return -1;
    }

  // Convert to grayscale
  cvtColorundefined src, src, CV_BGR2GRAY );

  // Apply Histogram Equalization
  equalizeHistundefined src, dst );

  // Display results
  namedWindowundefined source_window, CV_WINDOW_AUTOSIZE );
  namedWindowundefined equalized_window, CV_WINDOW_AUTOSIZE );

  imshowundefined source_window, src );
  imshowundefined equalized_window, dst );

  // Wait until user exits the program
  waitKeyundefined0);

  return 0;
}
After Histogram Equalization Image:
Frequency distribution table of before histogram equalisation image:
Frequency distribution table of histogram equalized image:
Note: The difference between two frequency distribution table and the corresponding image before histogram equalization to that after histogram equalization
Frequency distribution table of before histogram equalisation image:
Frequency distribution table of histogram equalized image:
Note: The difference between two frequency distribution table and the corresponding image before histogram equalization to that after histogram equalization


No comments:
Post a Comment